

Confusion Matrix: Overview and Applications
Table of Contents
- 1. Introduction
- 2. What is a Confusion Matrix?
- 3. Components of the Confusion Matrix
- 4. Evaluation Metrics Derived from the Confusion Matrix
- 5. Confusion Matrix Example in Classification
- 6. References
1. Introduction
The confusion matrix is a tool used to evaluate the performance of classification models. It shows how well the model predicts each class correctly or incorrectly.
2. What is a Confusion Matrix?
A confusion matrix is a table that displays the number of correct and incorrect predictions made by a classification model compared to the actual labels.
3. Components of the Confusion Matrix
In a binary classification problem, the confusion matrix consists of four parts:
- True Positive (TP): Correctly predicted as Positive
- True Negative (TN): Correctly predicted as Negative
- False Positive (FP): Incorrectly predicted as Positive (actually Negative)
- False Negative (FN): Incorrectly predicted as Negative (actually Positive)
4. Evaluation Metrics Derived from the Confusion Matrix
4.1 Accuracy
The ratio of correct predictions over the total number of samples:
\(\text{Accuracy} = \frac{TP + TN}{TP + TN + FP + FN}\)
4.2 Precision
The proportion of correct Positive predictions:
\(\text{Precision} = \frac{TP}{TP + FP}\)
4.3 Recall
The proportion of actual Positives correctly predicted:
\(\text{Recall} = \frac{TP}{TP + FN}\)
4.4 F1-Score
The harmonic mean of Precision and Recall:
\(\text{F1} = 2 \times \frac{\text{Precision} \times \text{Recall}}{\text{Precision} + \text{Recall}}\)
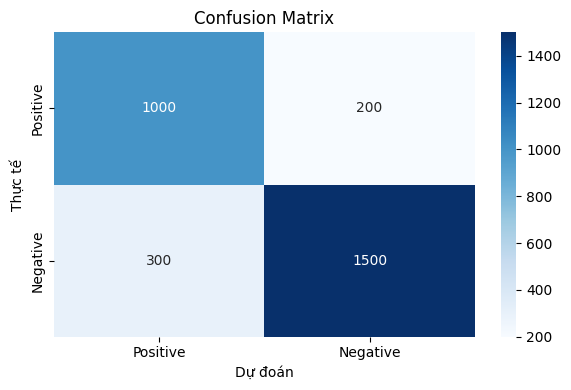
5. Confusion Matrix Example in Classification
Suppose we have a binary classification task with the following results:
| Sample Count | Ground Truth | Prediction |
|---|---|---|
| 1000 | Positive | Positive |
| 200 | Positive | Negative |
| 1500 | Negative | Negative |
| 300 | Negative | Positive |
We get:
- TP = 1000
- TN = 1500
- FP = 300
- FN = 200
Evaluation metrics:
\[\text{Accuracy} = \frac{1000 + 1500}{1000 + 1500 + 300 + 200} = \frac{2500}{3000} = 0.8333\] \[\text{Precision} = \frac{1000}{1000 + 300} = \frac{1000}{1300} \approx 0.7692\] \[\text{Recall} = \frac{1000}{1000 + 200} = \frac{1000}{1200} \approx 0.8333\] \[\text{F1} = 2 \times \frac{0.7692 \times 0.8333}{0.7692 + 0.8333} \approx 0.8000\]6. References
[1] Scikit-learn Developers. sklearn.metrics.confusion_matrix — scikit-learn 1.4.2 documentation. 🔗 https://scikit-learn.org/stable/modules/generated/sklearn.metrics.confusion_matrix.html